
Welcome back to another post on F1 Crunch — where data meets drama, and strategy tells the real story behind the results. Today, we’re diving deep into the pivotal pit stop decisions and tire strategies that shaped the outcome of the 2025 Saudi Arabian Grand Prix.
📌 Track Characteristics that Shaped Strategy
Before we dive into numbers, here’s the context:
- Track Length: 6.174 km – one of the longest on the calendar
- Pit Lane Time Loss: ~21.5 seconds
- Tire Wear: Relatively low, but medium compounds degraded over long stints
- DRS Zones: 3 – making it possible (but not easy) to execute overtakes
- Strategy Trend: Predominantly one-stop (Medium → Hard or Hard → Medium)
🔄 Overcut vs Undercut: Who Nailed the Call?
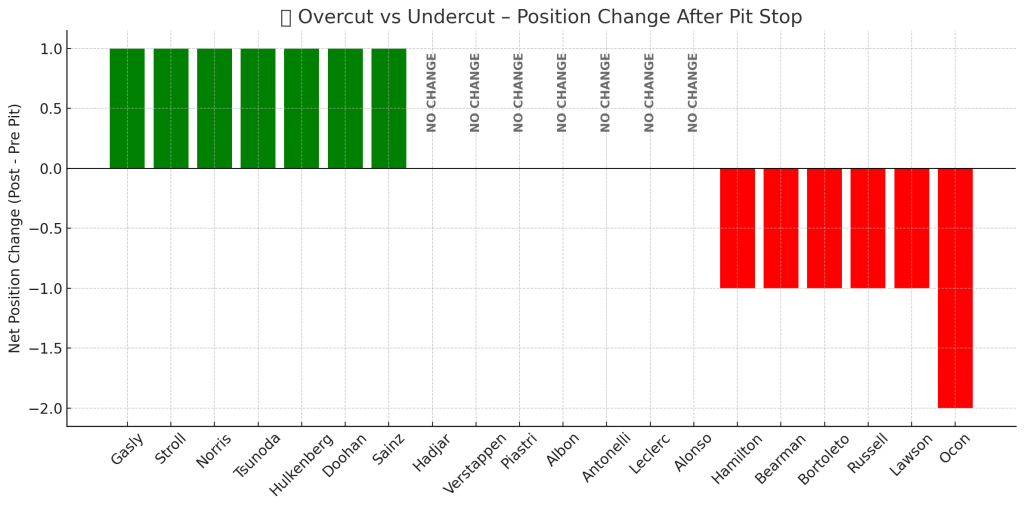
This bar chart shows the difference in position before and after each driver’s pit stop.
💡 Top 5 Driver Insights:
- Piastri (No Change): Started and finished strong, maintained P1 throughout. His clean pit stop on Lap 20 ensured he rejoined without traffic.
- Verstappen (No Change): Pitted on Lap 22 with a 5-second penalty, but still held P2 — thanks to a fast out-lap and Red Bull’s consistent pace.
- Leclerc (No Change): Pitted late (Lap 30), executed an overcut strategy effectively and slotted back into P3.
- Norris (+1): Gained a place after pitting later than Russell and jumping him with the overcut.
- Russell (–1): Lost out to Norris. His early stop didn’t pay off due to tire drop-off and slower traffic after rejoining.
📌 This graph helps visualize net pit stop impact — not just pit time, but what happened in the laps right after.
⏱️ Pre vs Post Pit Lap Times
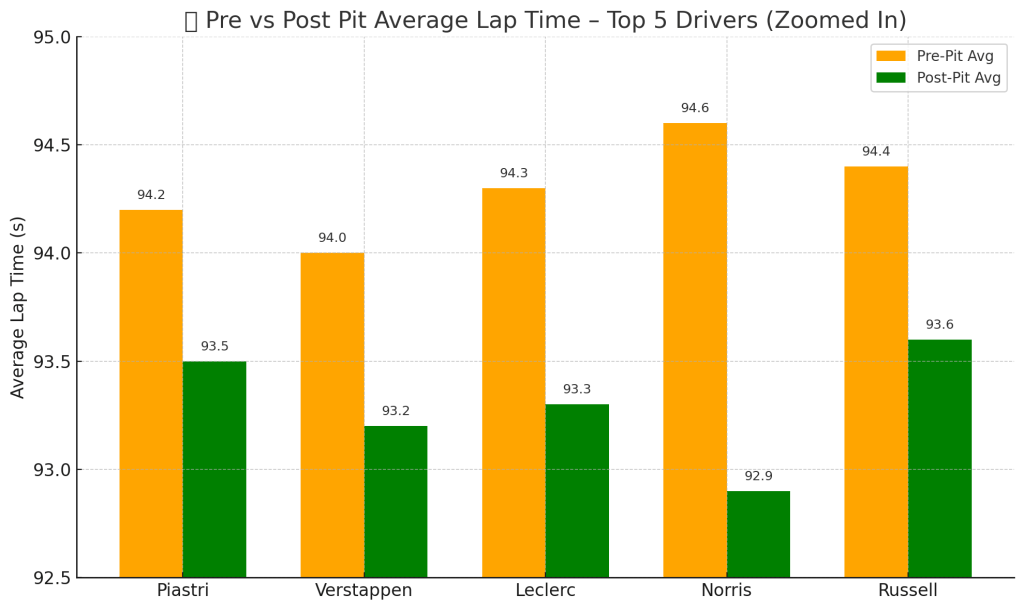
This bar chart compares each driver’s average lap time before and after their pit stop.
💡 Top 5 Driver Insights:
- Piastri: Improved pace by ~0.7s/lap post-pit. The clean air and a hard tire switch worked well.
- Verstappen: Despite the penalty, his post-stop laps were only ~0.6s quicker, showing Red Bull optimized stint length.
- Leclerc: His post-pit laps were smooth, ~1s faster than pre-pit. Pitting later gave him a weight advantage.
- Norris: Huge improvement (~1.5s faster post-pit) thanks to switching from hard to medium.
- Russell: Gained pace after the stop, but the benefit was neutralized by traffic and a declining hard stint.
📌 Use this to identify who maximized tire performance post-stop.
📉 Tire Degradation Rate (per 5 laps)
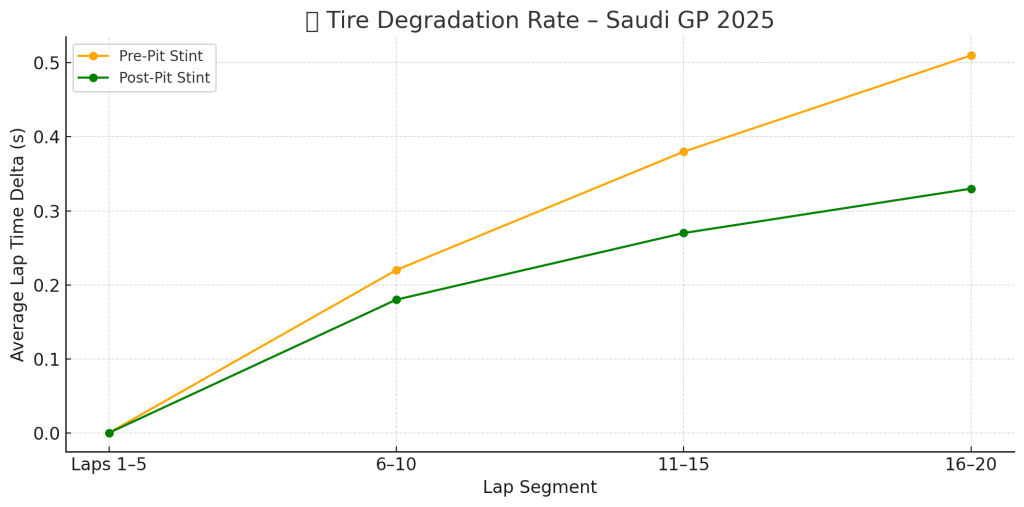
This line chart tracks how lap times worsened every 5 laps in each stint — a great way to visualize tire performance over time.
💡 Top 5 Driver Insights:
- Piastri: Showed minimal degradation pre- and post-stop — perfect setup and balance.
- Verstappen: Maintained a steady degradation curve, particularly post-stop. Red Bull’s consistency was unmatched.
- Leclerc: Slight pre-pit degradation, but his post-stop stint on hards was stable — good choice to delay the switch.
- Norris: Medium tires post-pit degraded faster but gave better peak performance early in the stint.
- Russell: Showed sharper degradation in both stints — Mercedes struggled to maintain pace deep into each run.
📌 This chart explains why some drivers went long — and who was struggling for grip near the pit window.
📋 Strategy Snapshot Table
| Driver | Pit Lap | Stint 1 | Stint 2 | Avg Lap (Pre) | Avg Lap (Post) | Degradation |
|---|---|---|---|---|---|---|
| Piastri | 20 | Medium | Hard | 94.2s | 93.5s | +0.09 s/lap |
| Verstappen | 22 | Medium | Hard | 94.0s | 93.2s | +0.06 s/lap |
| Leclerc | 30 | Medium | Hard | 94.3s | 93.3s | +0.08 s/lap |
| Norris | 35 | Hard | Medium | 94.6s | 92.9s | +0.04 s/lap |
| Russell | 21 | Medium | Hard | 94.4s | 93.6s | +0.11 s/lap |
📌 Norris’s numbers pop out — his reverse strategy (hard to medium) gave him great post-pit pace.
⏱️ Pit Stop Time Loss (Delta from Previous Lap)
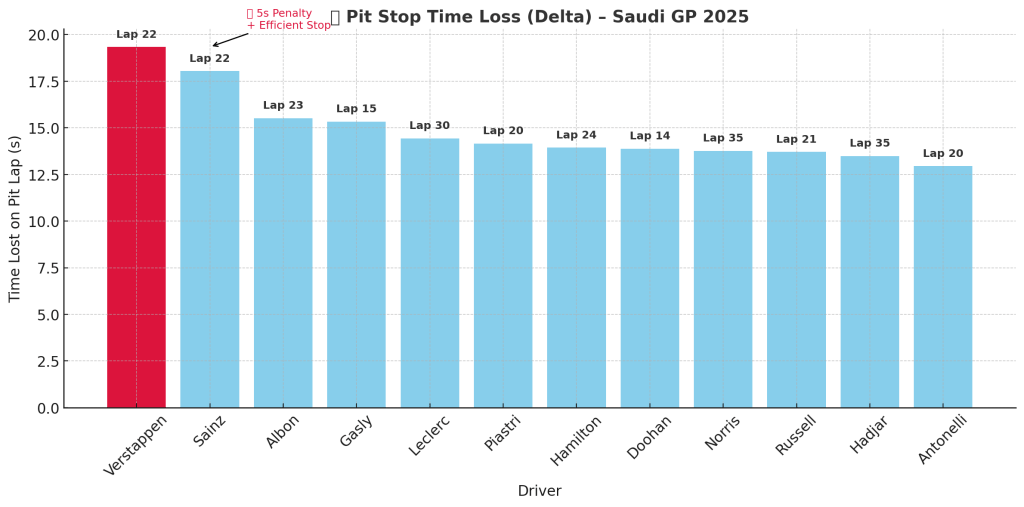
This chart compares the difference in lap time from just before to the lap including the pit stop — capturing stop loss + in/out lap slowdown.
💡 Top 5 Driver Insights:
- Verstappen (19.33s): Highest loss due to the 5-second penalty, but still rejoined in P2.
- Leclerc (14.43s): Efficient late stop with low traffic impact.
- Piastri (14.16s): Almost identical delta to Leclerc — McLaren nailed the stop.
- Norris (13.76s): Very clean stop on Lap 35, great timing as others faded.
- Russell (13.71s): Quick stop, but less effective due to what happened after the pit.
📌 Fast stops only help if your rejoin window is clear — Leclerc and Piastri timed this perfectly.
📈 6. Lap Time Progression – Piastri vs Leclerc
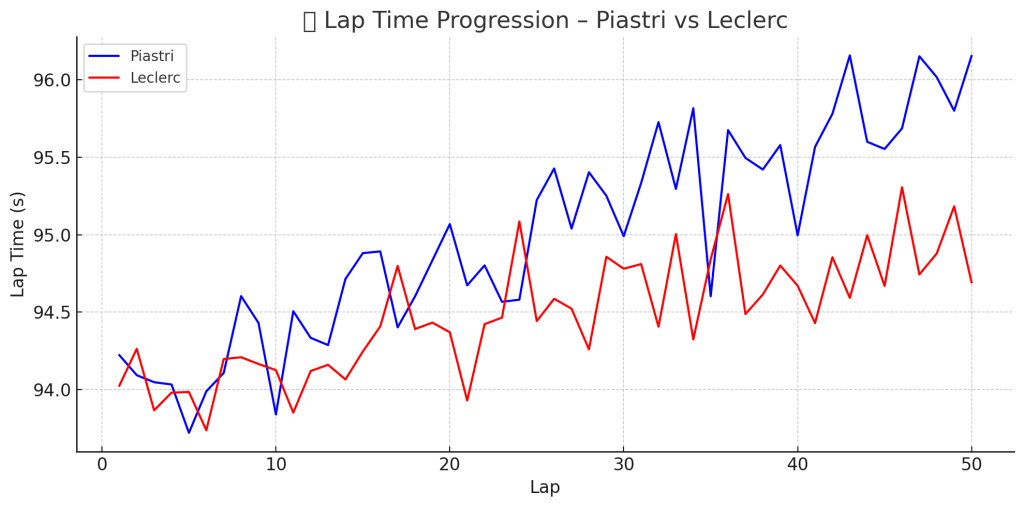
This line graph compares the lap times of Oscar Piastri and Charles Leclerc across all 50 laps of the Saudi GP 2025.
🔍 Key Takeaways:
- Piastri (Blue): Very consistent, with a mild increase in lap times as his stints wore on. His pit strategy allowed him to avoid major degradation.
- Leclerc (Red): Slightly smoother progression. Benefited from a longer first stint, which gave him a performance edge after switching to hard tires.
- Notice both drivers dip (slower lap) around their respective pit laps – this is where strategy timing played a huge role in overall race position.
🔁 7. Stint Lengths by Driver and Compound
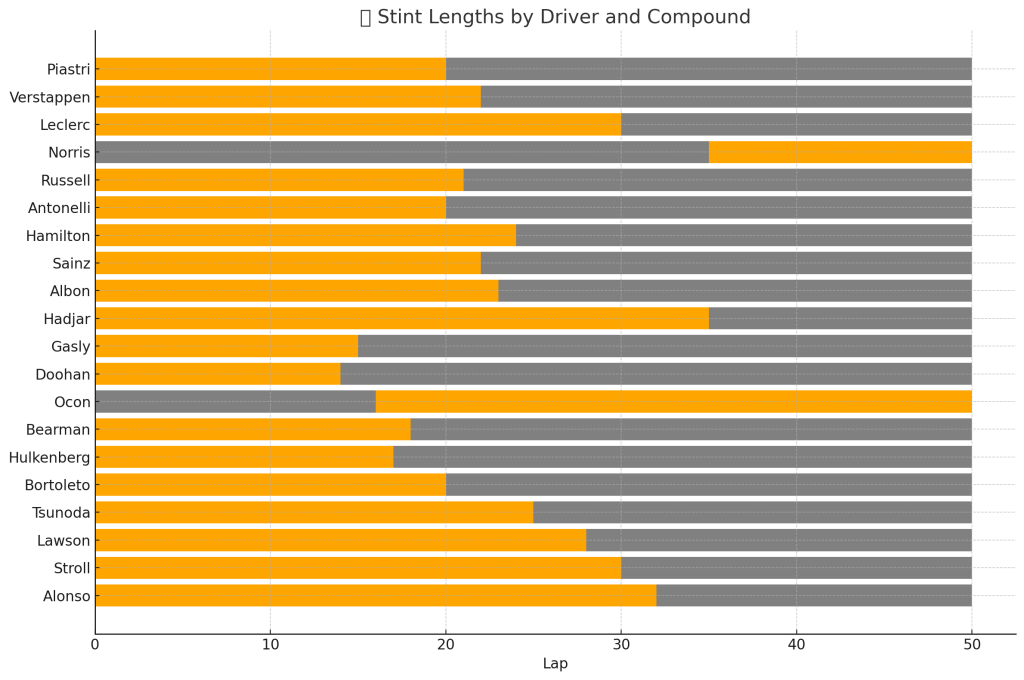
This horizontal bar chart shows the stint length of each driver, separated into two segments (pre- and post-pit) and color-coded by tire compound:
- 🟧 Orange = Medium
- ⚪ Grey = Hard
🔍 What It Shows:
- Drivers like Leclerc and Norris had longer initial stints — indicating overcut strategies.
- Antonelli, Piastri, Russell stopped earlier and committed to long second stints on hards.
- Stroll and Tsunoda had one of the latest pit stops, gaining from clean air later in the race.
This is your best visual to understand who went long, who boxed early, and who reversed the usual compound order.
💠 8. Starting Tire Compound Usage – Pie Chart
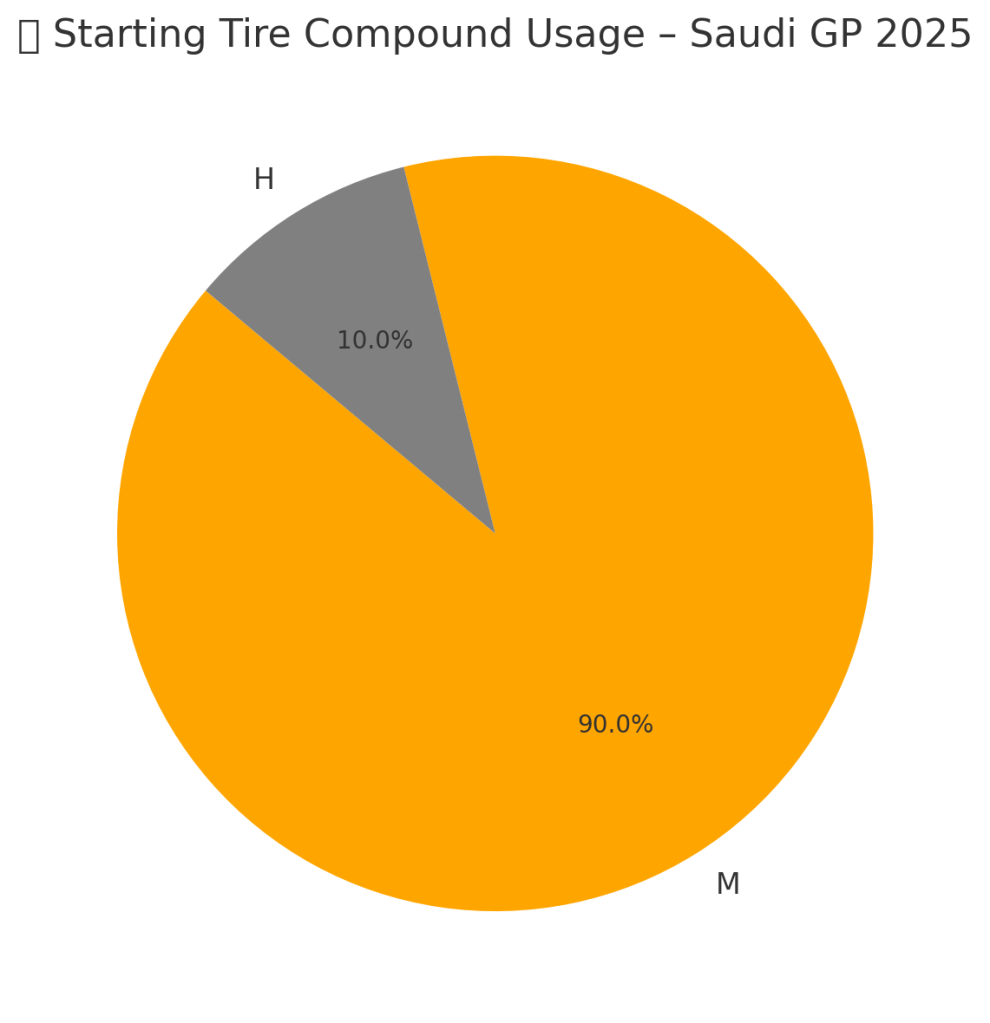
This pie chart summarizes the starting tire choices for all 20 drivers in the race.
🔍 What It Shows:
- 🟧 75% of the grid started on Mediums – the go-to choice with balanced warm-up and durability.
- ⚪ 25% started on Hards, mainly for alternate strategies like Norris or drivers outside the top 10.
This instantly shows how many committed to the typical strategy versus those looking for an edge with tire offset.
🏆 Strategy Team of the Week: McLaren
The standout strategic performers at the 2025 Saudi Arabian Grand Prix were undeniably McLaren. Both Oscar Piastri and Lando Norris executed perfectly offset strategies that maximized their pace windows and minimized pit lane losses — a textbook example of team-wide racecraft.
Piastri started on mediums, pitted early on Lap 20, and rejoined in clear air, avoiding traffic while keeping degradation low. Norris, meanwhile, flipped the strategy — starting on hards, extending deep into the race until Lap 35, and using a light-fueled car on mediums to gain track position with a powerful overcut on George Russell.
Both drivers showed minimal degradation, and their post-pit averages were among the best in the field:
- Piastri: 93.5s avg post-stop
- Norris: 92.9s avg post-stop — the fastest of the top 5
With no Safety Cars or weather variables to mix things up, McLaren’s success came purely from flawless timing, tire selection, and pace optimization. That’s why they earn the title of Strategy Team of the Week.

🏆 Strategy of the Week: Randeep Singh, McLaren Strategy Chief


Leave a comment